In-line Process Spectrometers
What is Spectroscopy?
Find out more about UV-Vis, Near-Infrared and Raman Spectroscopy
What is UV-Vis Spectroscopy?
What is Near-Infrared Spectroscopy?
What is Raman Spectroscopy?
What is UV-Vis Spectroscopy?
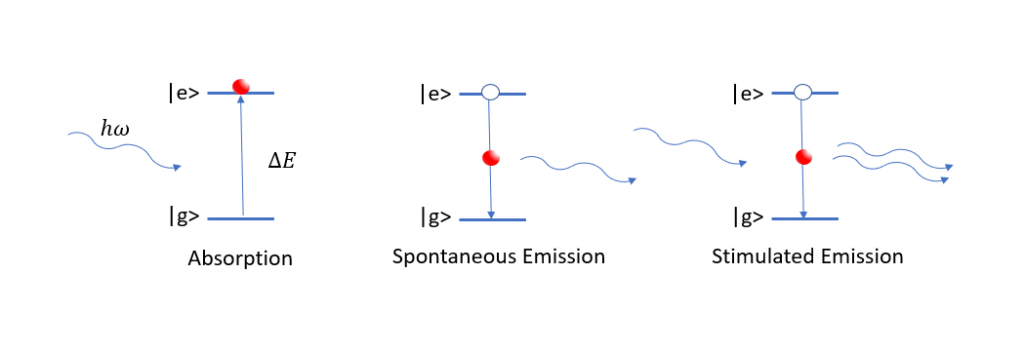
(Left) A resonant photon is absorbed inducing a transition between the ground and excited states. (Middle) An electron spontaneously falls to a lower state releasing a photon. (Right) A photon knocks the electron out from the excited state and a second photon is released.
UV-Visible spectroscopy considers the span of wavelengths ranging from 200 – 700nm. When light is incident upon a material, certain wavelengths will be resonant, or equal in energy, with transitions between energy states in the medium. These wavelengths are absorbed, inducing electronic transitions where electrons are promoted to higher states. Once in an excited state, an electron can drop back down to its initial state, emitting a photon equal in energy to the one it absorbed on the way.
For UV-Vis spectroscopy, a broad range of light sources is used to excite multiple transitions in a material. The plot of the transition intensity vs. the wavelength is referred to as a spectrum. The spectrum can be plotted in terms of transmission, how much light passed through the material, or absorbance, how much light was absorbed at a particular wavelength.
How Are Transmission, Absorbance and Concentration Related?
As light passes through a medium, light is absorbed and the intensity of the transmitted light is given by, IT (λ)=I0e-ε(λ)lc where ε(λ) is the wavelength-dependent molar absorptivity constant, l is the path length and c is the concentration of particles in the medium. Substituting the transmittance, T=IT/I0 and absorbance, A=-log(T) yields, A= εlc This is known as the Beer-Lambert Law, which states that the absorption of light, at a specific wavelength, as it passes through a medium is proportional to the concentration of a substance within that medium. This implies that concentrations of chemical species in a particular sample can be related quantitatively to the spectra that are produced with an optical measurement. Quantitative measurements are parameterized by statistical methods known as chemometrics, which relate the relative intensities in the spectra to the actual concentrations found using traditional laboratory methods. These models can then be used in the process to predict the concentrations of unknown samples in real-time.
Applications of UV-Vis Spectroscopy

Due to its non-destructive nature, UV-Vis spectroscopy is a versatile tool typically used to make quantitative measurements of chemicals in a given sample including both inorganics and organics. It is frequently used to analyze impurities in organic compounds, such as in food and pharmaceuticals, and can be coupled with separation-based techniques such as chromatography or inductively coupled plasma to measure emission from constituents in a sample as separation is achieved. It is also often used for colorimetry, thin-film analysis, electroplating, etc.
Explore More About UV-Vis Applications


Inisights